
Probability
The probability scale, outcomes and expected results

Probability measures how likely something is to happen, from impossible (0) to certain (1).
Working out probability
P(event) = number of ways it can happen ÷ total number of outcomes
- Probabilities can be fractions, decimals or percentages: ½ = 0.5 = 50%.
- P(not happening) = 1 − P(happening).
- The probabilities of all the possible outcomes add up to 1.
- Expected number = probability × number of trials.
- Use a sample space diagram to list outcomes for two events, like two dice (36 outcomes).
Worked examples
Example 1. A bag has 3 red, 5 blue and 2 green counters. Find P(blue).
Example 2. The probability it rains tomorrow is 0.3. What is the probability it does not rain?
Example 3. A fair dice is rolled 120 times. How many sixes would you expect?
Example 4. Two coins are flipped. What is P(two heads)?
Top tips and common mistakes
- A probability can never be more than 1 or less than 0.
- Fair means every outcome is equally likely.
- Relative frequency (from experiments) = number of successes ÷ number of trials.

I tested if my coin was fair by flipping it 100 times. 52 heads: pretty fair!
Practise
Answer as many as you like. Every question is new, and you get a “correct” tick for each one you get right first time. Use “Show answer” to see a worked solution.
Quiz: earn your stamp
Printable worksheet
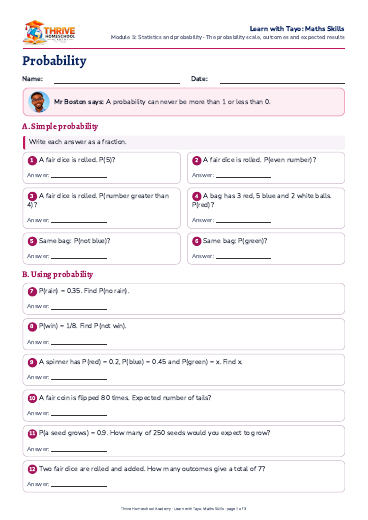
Probability worksheet. The questions come first and the answers for grown-ups are on the last page, so you can print just the question pages.
Printing is optional. A4 size.