
Charts and graphs
Tables, bar charts, pie charts, line graphs and scatter graphs

Charts turn numbers into pictures so we can see patterns at a glance.
Choosing and reading charts
- Tally and frequency tables organise data.
- Bar charts compare categories. Leave gaps between bars.
- Pie charts show proportions. The whole circle is 360°: angle = (frequency ÷ total) × 360°.
- Line graphs show change over time.
- Scatter graphs show whether two things are linked (correlation): positive, negative or none.
Worked examples
Example 1. In a survey of 60 people, 15 chose football. What angle is football on a pie chart?
Example 2. A pie chart of 40 pupils has a 72° slice for “walk”. How many pupils walk?
Example 3. Temperature against ice cream sales: as one goes up, so does the other. What correlation is this?
Top tips and common mistakes
- Always check the scale on the axes: one square might mean 2, 5 or 10.
- Give charts a title and label both axes.
- Correlation does not prove one thing causes the other.

I made a bar chart of my family’s favourite fruit. Bananas won!
Practise
Answer as many as you like. Every question is new, and you get a “correct” tick for each one you get right first time. Use “Show answer” to see a worked solution.
Quiz: earn your stamp
Printable worksheet
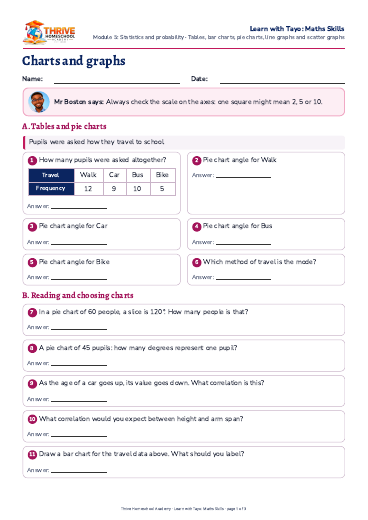
Charts and graphs worksheet. The questions come first and the answers for grown-ups are on the last page, so you can print just the question pages.
Printing is optional. A4 size.